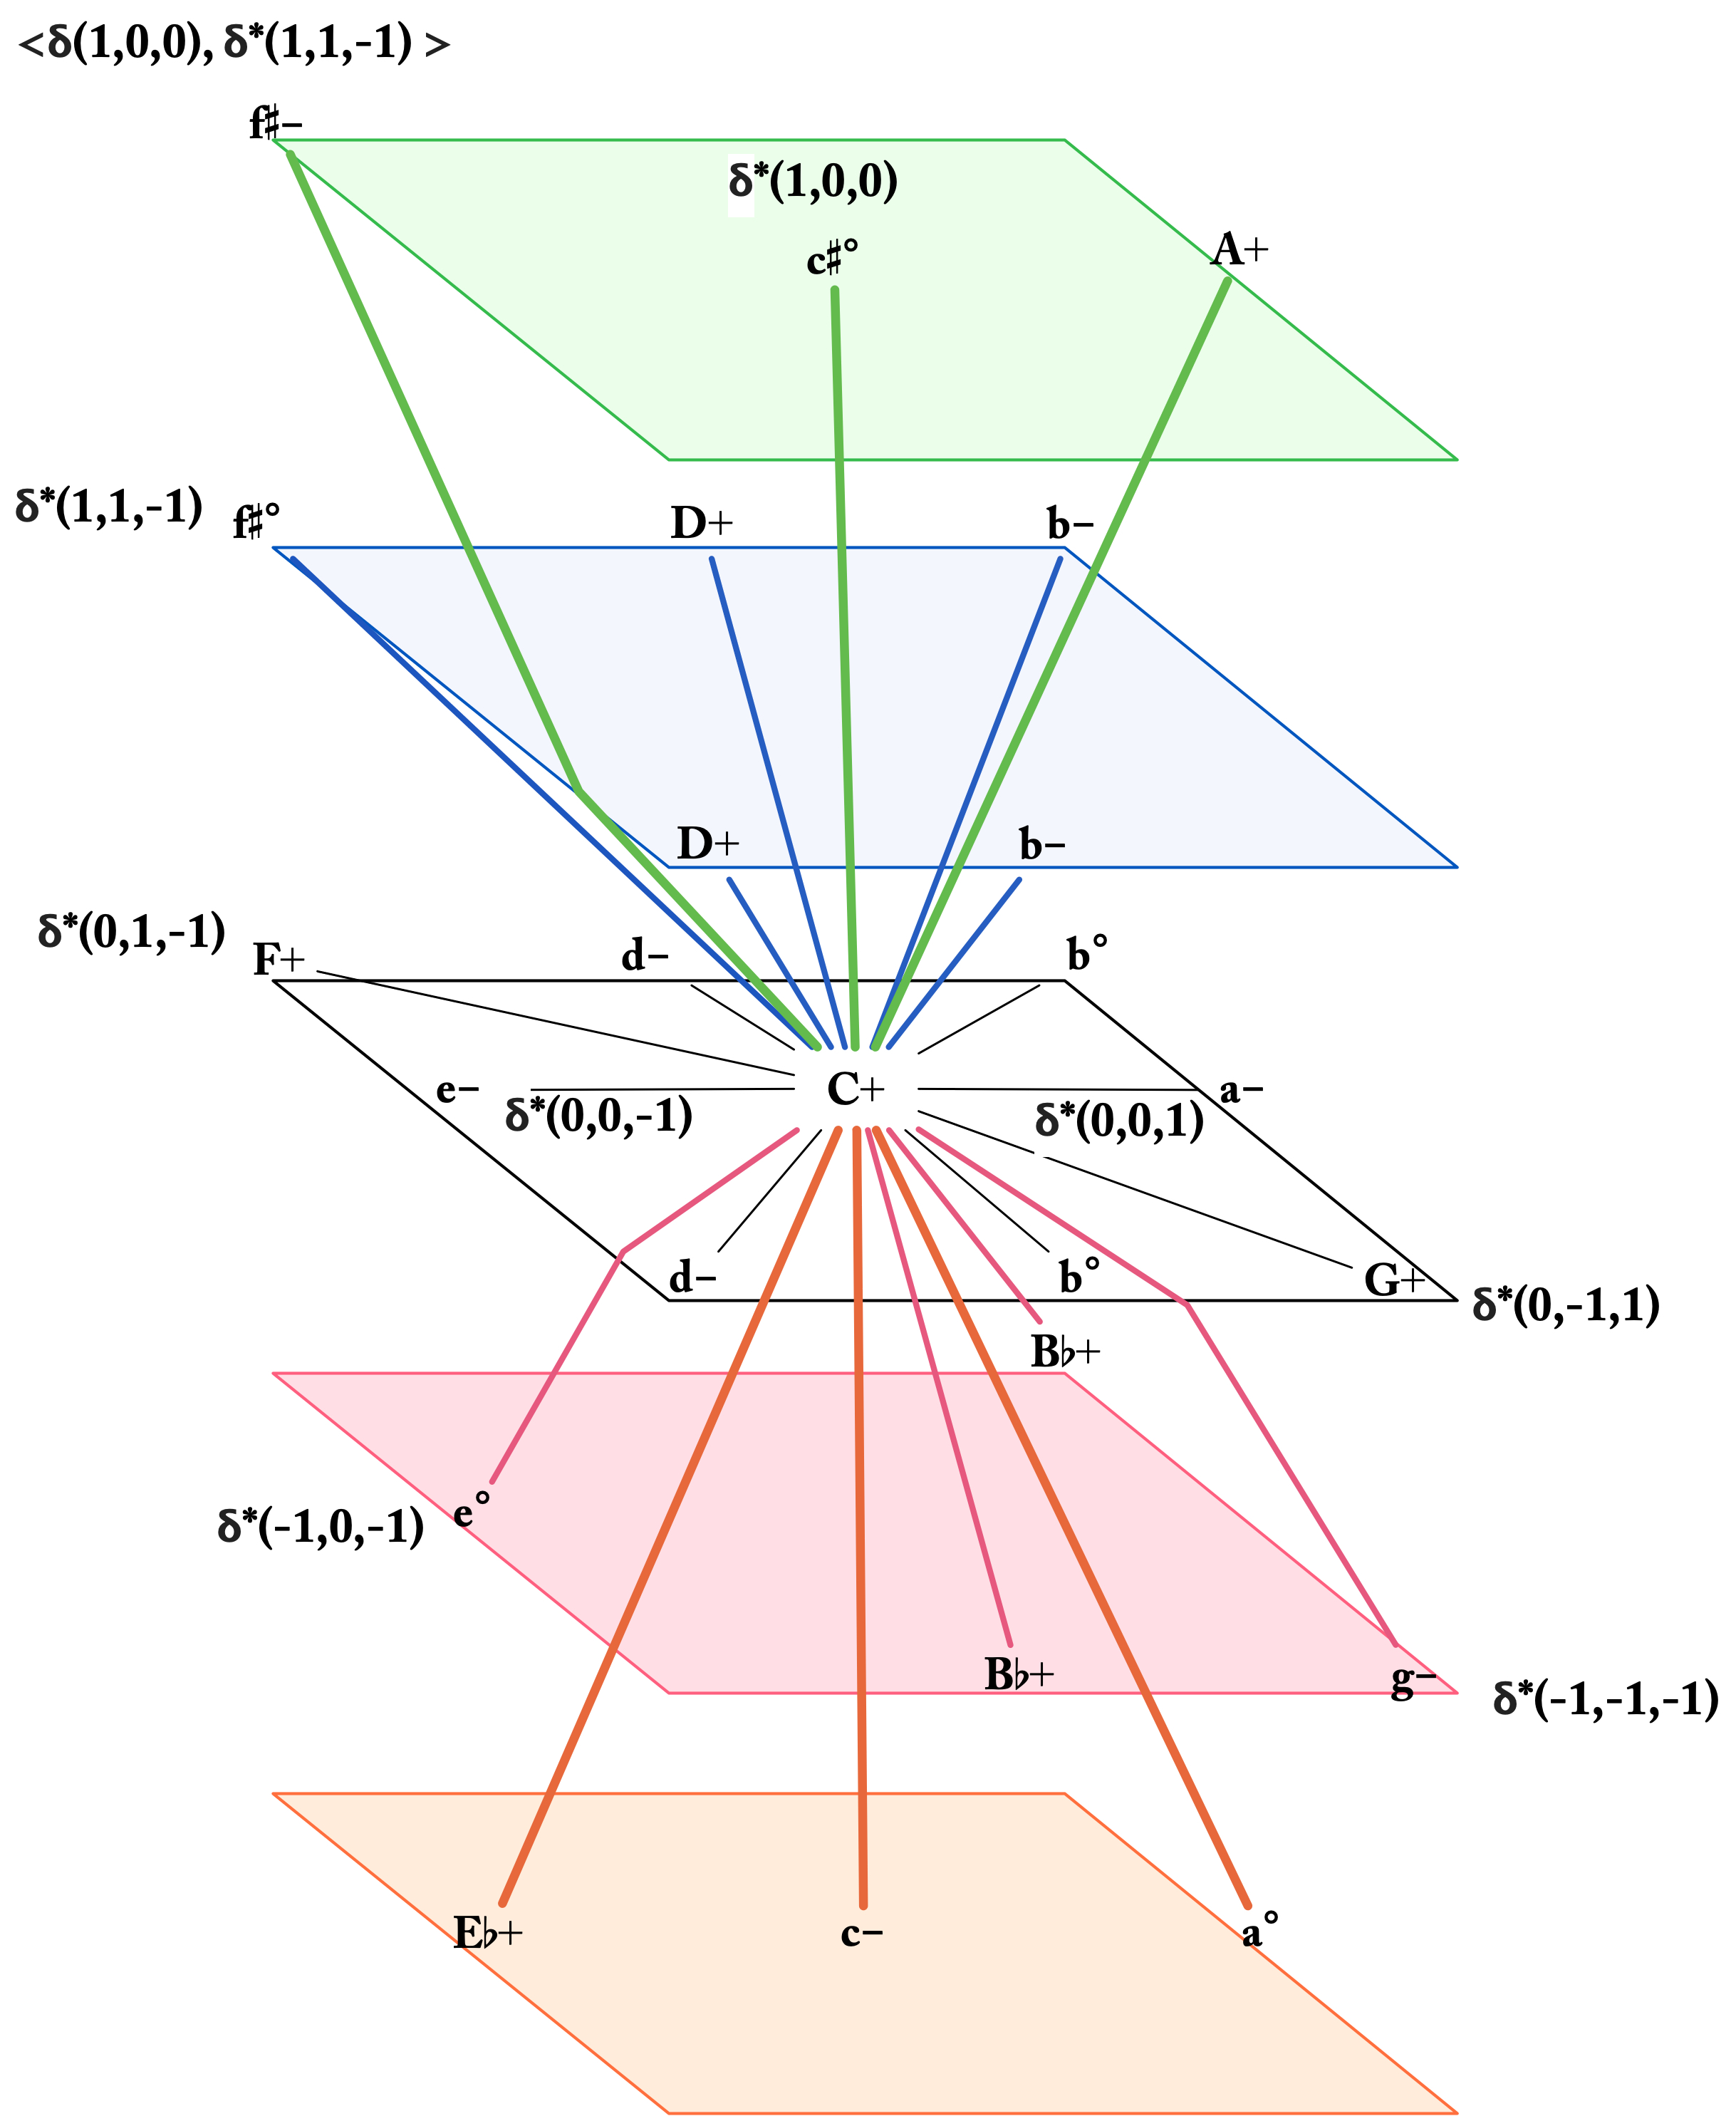
Example 48. A three-dimensional plot of 3→7(inner)→7(outer)→12 configuration space, where each vertical layer represents key changes caused by the outer 7-filter. Relationships relative to a C+ tonic chord are shown. Some labels for δ and δ*; have been added, to offer some perspective on the relationships between harmonies; the f#− triad at the top left corner is distinct from the f#° chord the layer below, because going from C+→f#− first involves changing from C+ as C:I to C+ as G:IV.