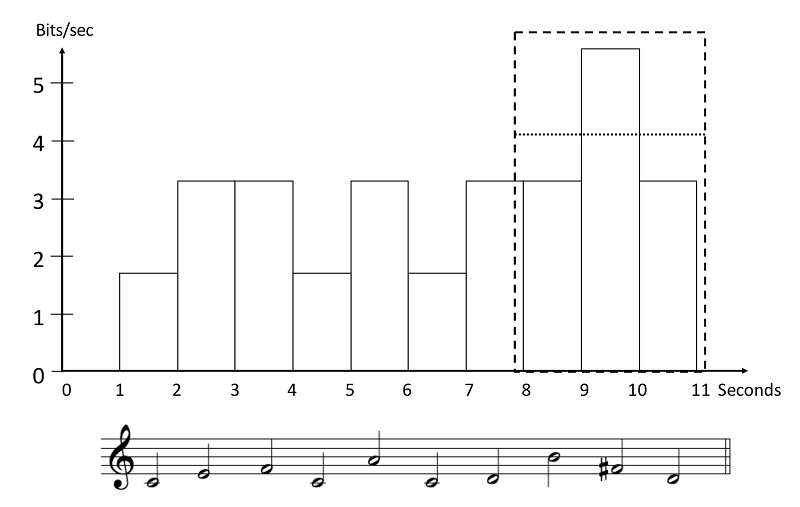
Example 5. The dashed rectangle shows a window of three events within which information density is calculated; the dotted line shows the resulting value (the melody is the same as in Example 3)