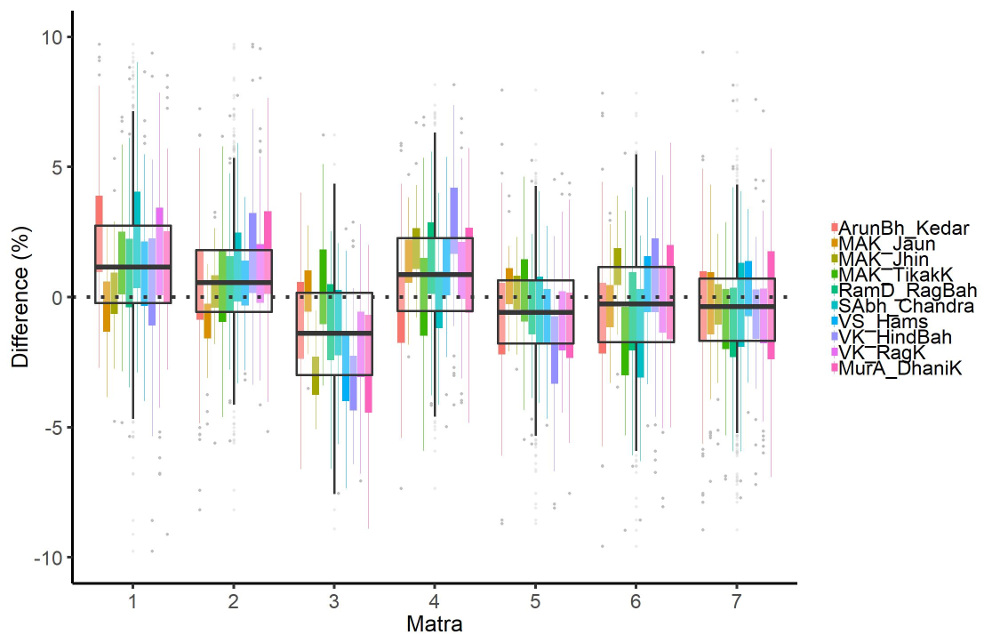
Example 14. Difference in mātrā lengths from isochrony. Black boxes indicate the overall distribution in the corpus, and colored boxes indicate the individual recordings. Outliers (values with a magnitude >10%) are excluded from the chart for ease of reading.