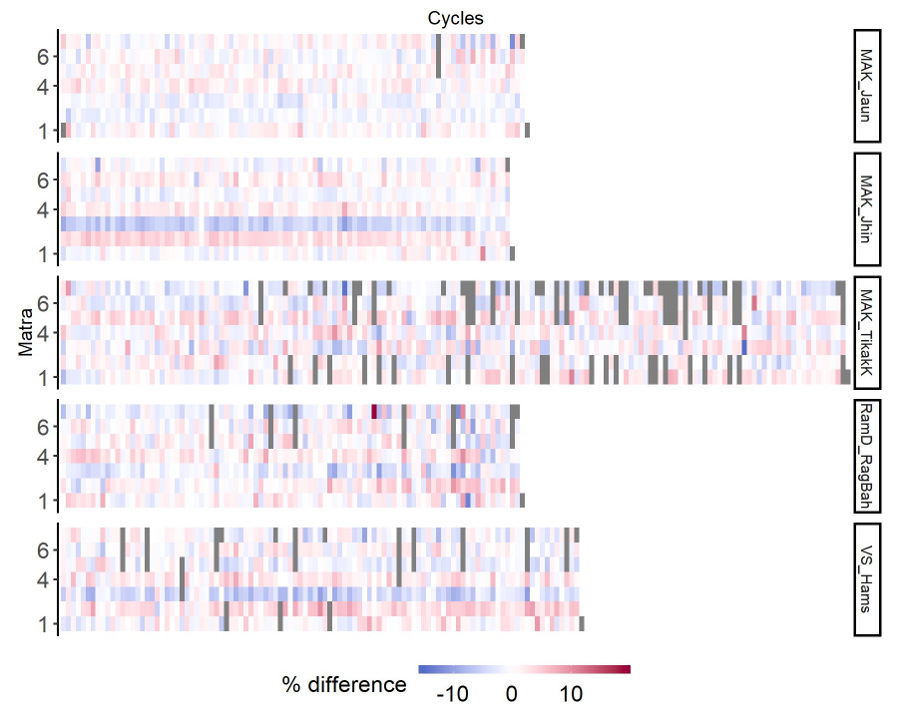
Example 15. Plot of differences in mātrā length from isochrony in four khyāl performances. Blue tiles indicate mātrās shorter than the equal subdivision of the cycle, and red tiles indicate mātrās longer than the equal subdivision of the cycle. Grey = missing data. Time runs left to right, with each column representing one cycle. The mātrās are represented in rows, from 1 at the bottom to 7 at the top.