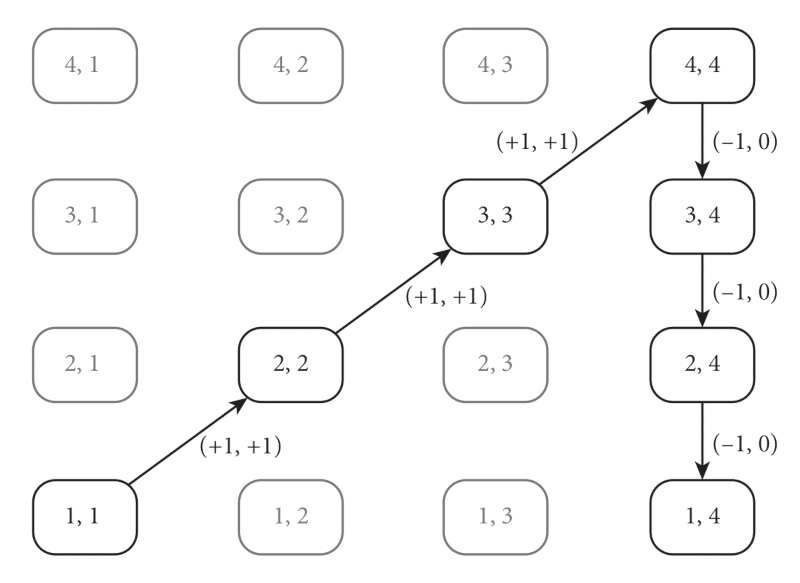
Example 1. De Souza’s Figure 7.8 (p. 170), which shows a transformation network based on Berry’s analysis of Darius Milhaud’s Six Sonnets, no. 3, mm. 1–7 (1987, 215). Textures are shown in the form (s, d) where s is the number of perceptual streams and d is a measure of density. The arrows moving toward the northeast show the texture increasing in both parameters, while the south-pointing arrows show the voices gradually fusing together into a single stream without losing density.