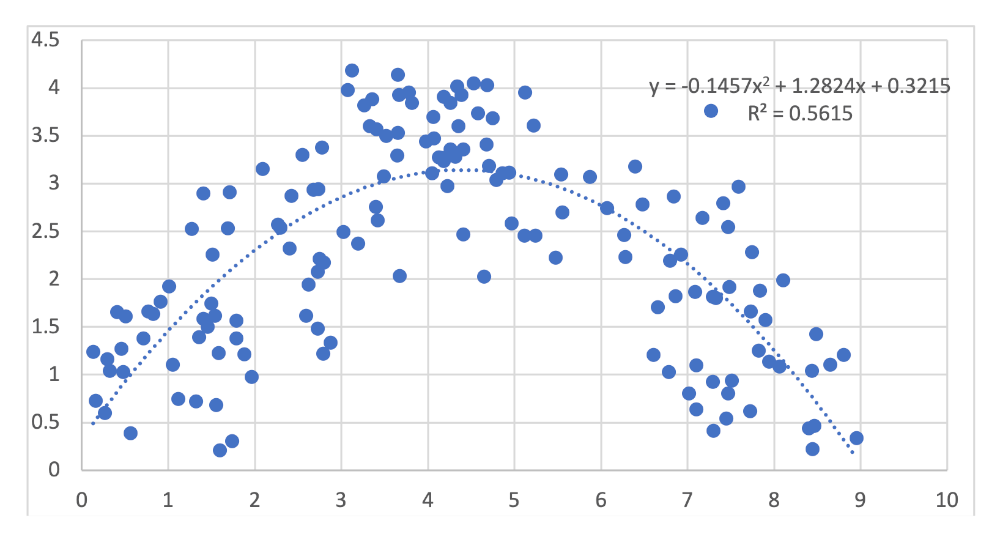
Example 4. Plot of data generated from equations Y = X (for X = 0 to X = 4.5) and Y = X-9 (for X = 4.5 to X = 9), with random noise aided to X and Y values., with quadratic trendline