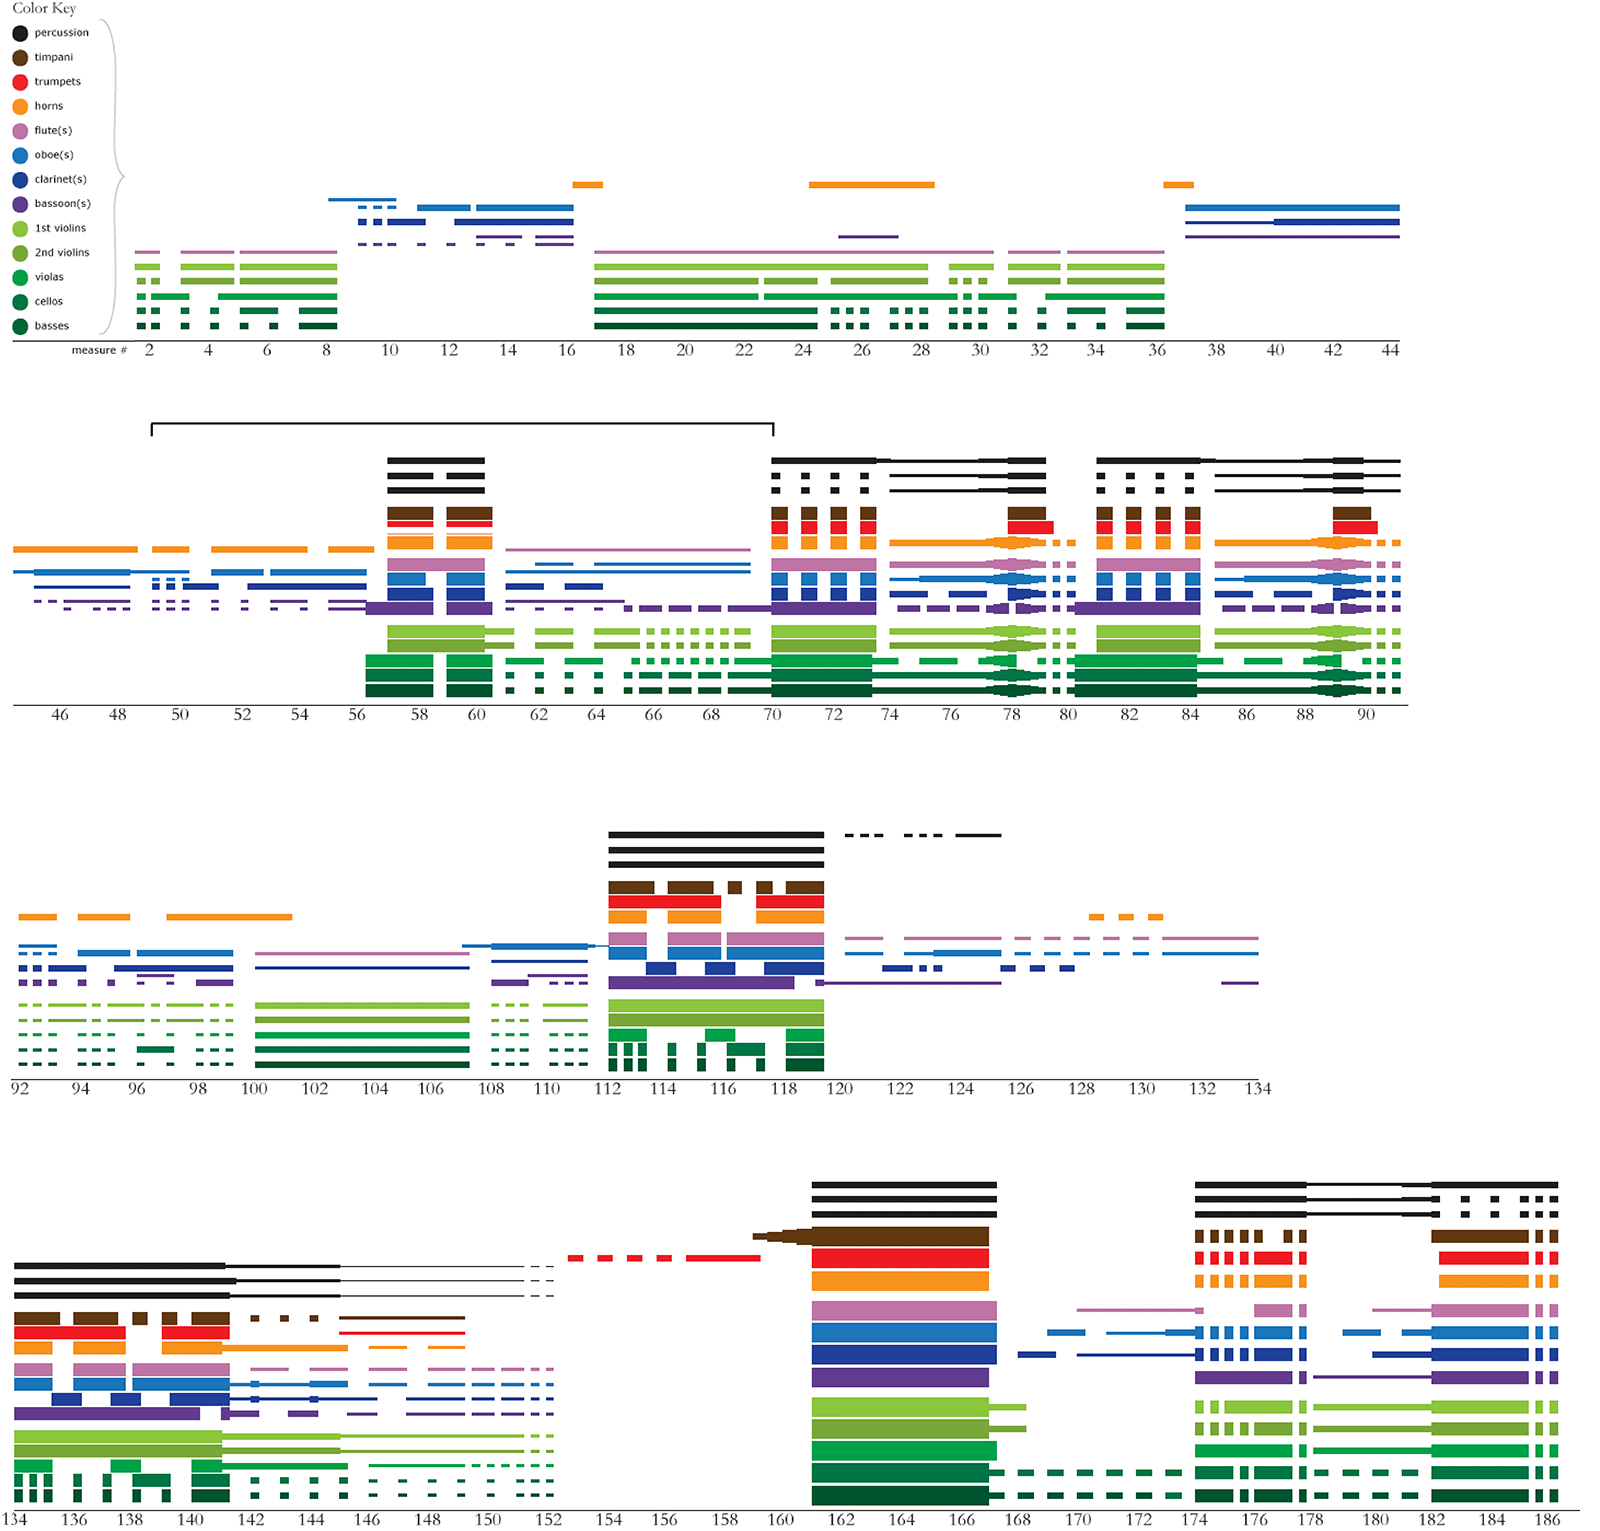
Example 27. Sectional boundaries: Dolan’s (2013b) orchestral graph of Haydn, Symphony no. 100, ii. Colors represent different instruments and the line thickness corresponds to notated dynamics. The instruments are arranged with strings at the bottom followed by woodwinds, brass, and percussion. The horizontal bracket over the second panel indicates the measures included in Audio example 22 (mm. 49–70) (from Dolan 2013b, used with permission) [simulation from OrchPlayMusic Library]