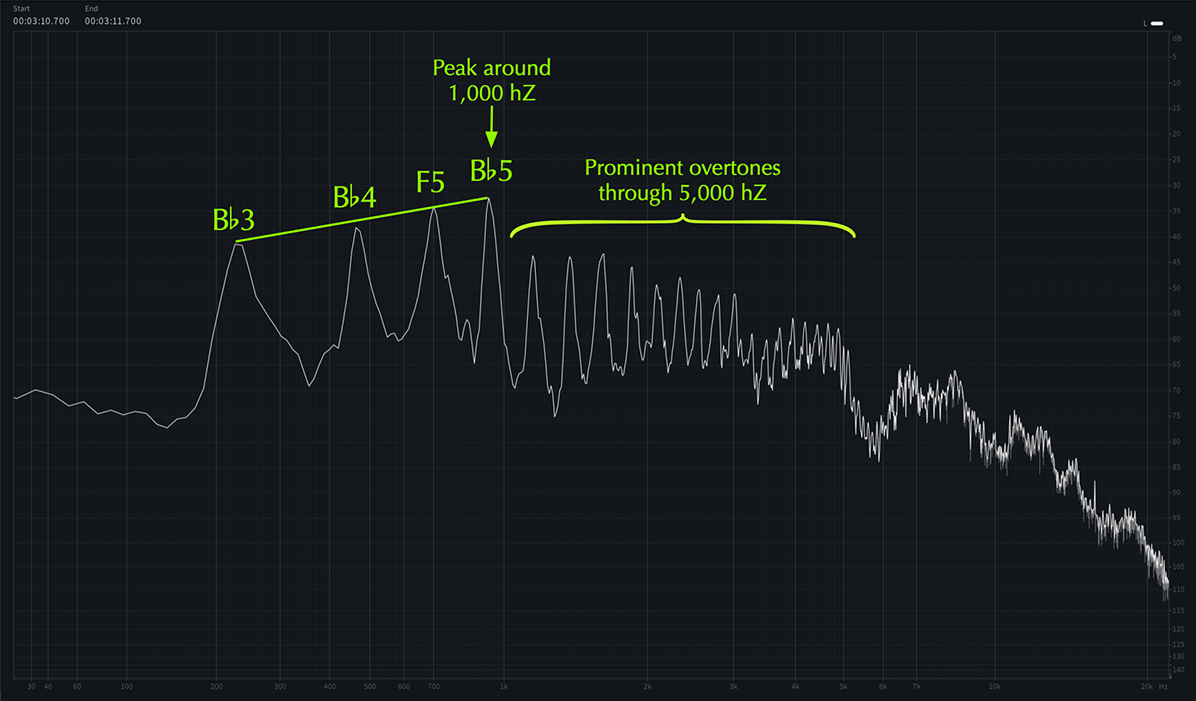
Example 7. Spectrum graph showing frequency amplitudes (averaged across “did ya think about your” from Example 5, all sung on B♭3)