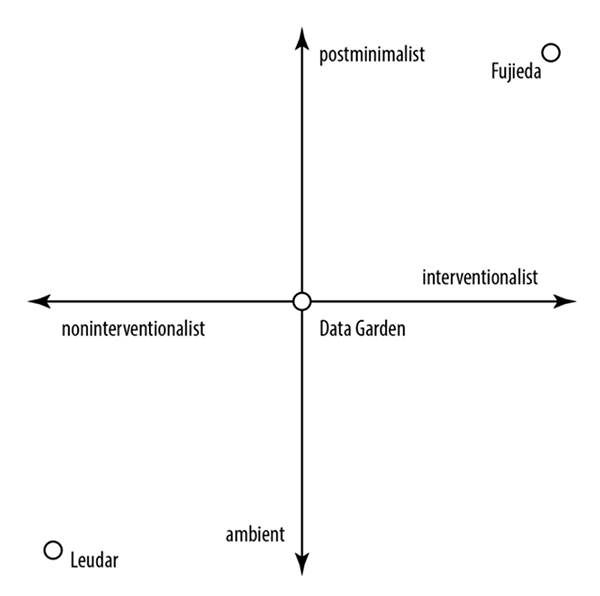
Example 18. Hypothetical scatter chart suggesting a correlation between the amount of intervention artists typically make interpreting biodata and the musical style that results