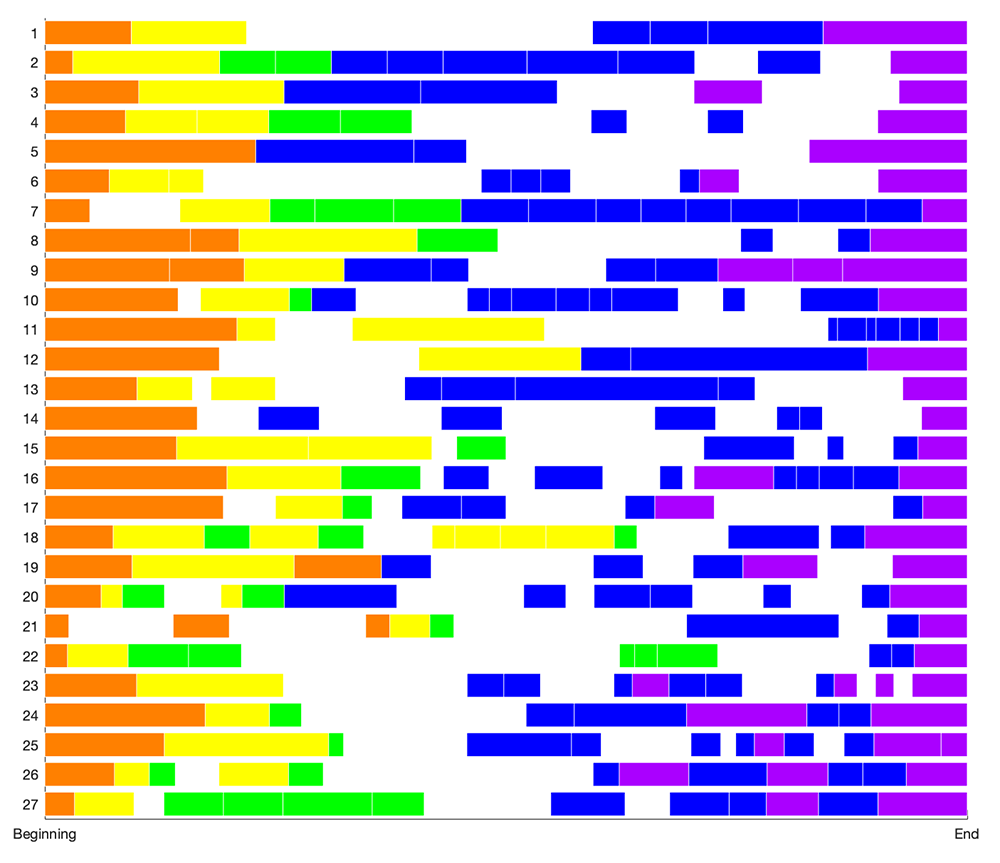
Example 17. An interopus comparison of the 27 pieces in the sample. The timing of all pieces is presented proportionally, wherein the leftmost point is 0% time (beginning of each piece) and the rightmost point is 100% (ending of each piece). The color coding represents analogous stages in terms of the model (mean white space is at 32.8%). The white space represents schemata that did not meet the threshold (or “non-specific” skeletal strings) and were therefore not tagged as part of a stage. The MATLAB script for the visualization is available in Appendix 4.