EXAMPLE TESTING
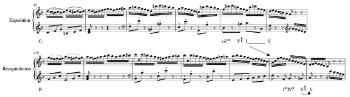
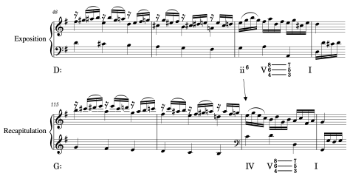
Example 1. Pre-dominant power up in Mozart, Piano Sonata, K. 545/i (last PAC of exposition/recapitulation).
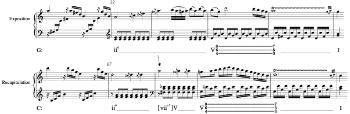
(click to enlarge)
Example 2. An excerpt of the dataset. Rows contain all dominant harmonies along with the three chords preceding each dominant in K. 545/i.
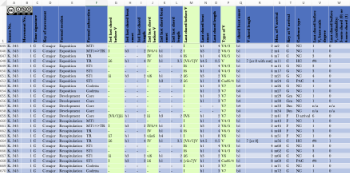
(click to enlarge)
Example 3. Frequency and percentages of V-1 based upon whether the chord is or is not at a cadence. (“Other” includes iii, vii°,
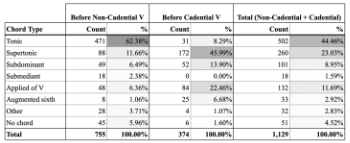
(click to enlarge)
Example 4. Frequency and percentages of bass scale degrees in V-1 based upon whether the chord is or is not at a cadence.
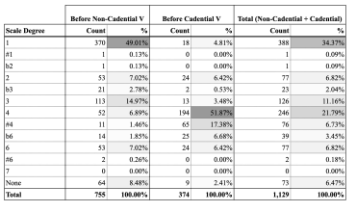
(click to enlarge)
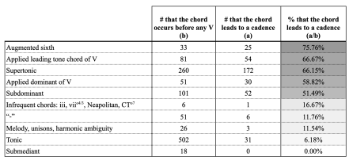
Example 5. Chord types before V in the dataset along with their frequency at various locations, arranged by how often they lead to a cadence (rightmost column).
(click to enlarge)
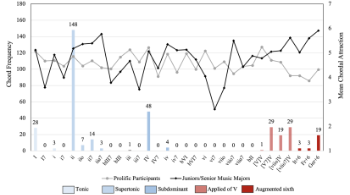
Example 6. Raw counts of chords in V-1 at a cadence (y-axis, left) for the 31 rated chords (x-axis) in Brown, Tan, and Baker (2021), with perceptual ratings (1–7 scale) superimposed (y-axis, right).
(click to enlarge)
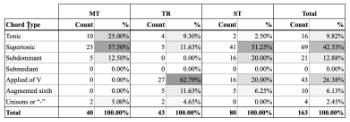
Example 7. Chord types in V-1 at the cadences ending main themes (MT1 and MT2), transitions (TR), and subordinate themes (ST1, ST2, and ST3) in both expositions and recapitulations.
(click to enlarge)
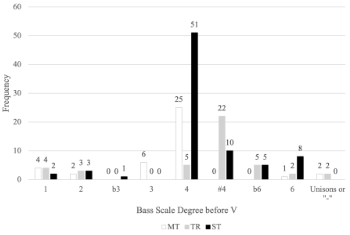
Example 8. Bass scale degrees that occur in V-1 at all cadences ending main themes (MT1 and MT2), transitions (TR), and subordinate themes (ST1, ST2, and ST3) in both expositions and recapitulations.
(click to enlarge)
Example 9. Chord types in V-1 at section-ending cadences in sonata form. For the main theme (MT), transition (TR), and subordinate theme (ST), the final V-1 chord was counted in the last section-ending cadence for these themes in the exposition and recapitulations. For codettas and coda, V-1 before the final V is counted. For the development, the V-1 chord before the final cadence in the submediant key (when present) and tonic key were counted.
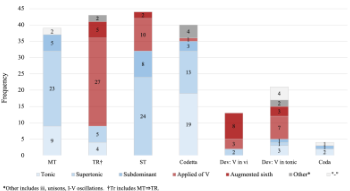
(click to enlarge)
Example 10. (A) Heatmap illustrating the frequency of transitions from the chord occurring two chords before V (“V-2” on the y-axis) to one chord before V (“V-1” on the x-axis) in the dataset. (B) Heatmap illustrating the frequency of transitions at cadences from V-2 (y-axis) to V-1 (x-axis) in the dataset.
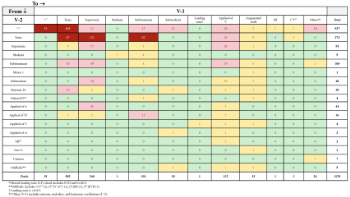
(click to enlarge)
Example 11. Heatmap organized by cadence type, illustrating progressions between all V-2 (y-axis) to V-1 (x-axis) chords.
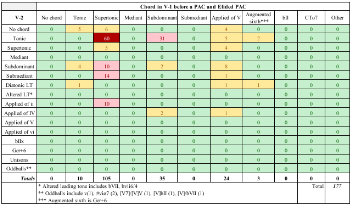
(click to enlarge)
Example 12. A reproduction of frequent chord progressions in the major mode as illustrated in the Kostka and Payne textbook (2009, 111).
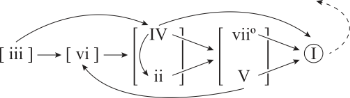
(click to enlarge)
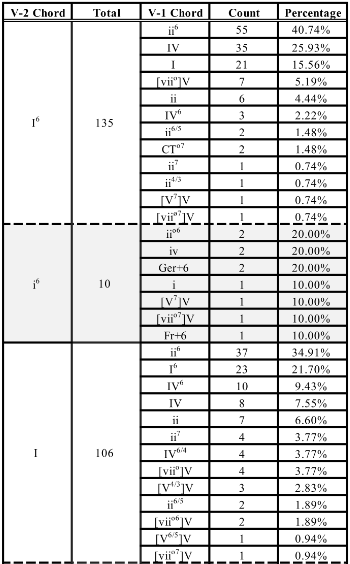
Example 13. The seven most frequent V-2 chords (first leftmost column) and their minor-mode counterparts if present in the dataset (in grey), followed by subsequent V-1 frequencies (third column). All chords in V-2 are presented in descending order of frequency, based on major-mode appearances. All chords in V-1 are presented in descending order of frequency.
(click to enlarge)
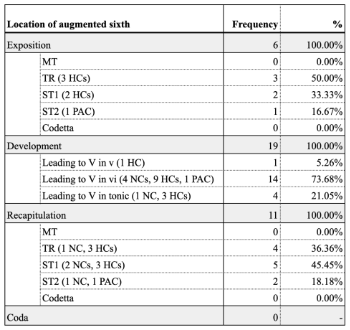
Example 14. Location and frequency of all 36 augmented sixth chords in the dataset (in V-3, V-2, and V-1 positions).
(click to enlarge)
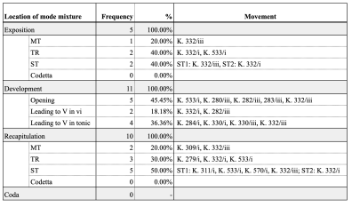
Example 15. Location and frequency of mode mixture in the dataset.
(click to enlarge)
Example 16. A pre-dominant power up in Mozart, Piano Sonata, K. 533/i (end of TR).
(click to enlarge)
Example 17. A pre-dominant power up with added measures in the recapitulation in Mozart, Piano Sonata, K. 332/iii (end of TR).
(click to enlarge)
Example 18. A pre-dominant power down in Mozart, Piano Sonata, K. 283/i (last PAC of exposition/recapitulation).
(click to enlarge)