EXAMPLE TESTING
Example 1. Measures 29–44 of Beethoven Pathétique Sonata, II
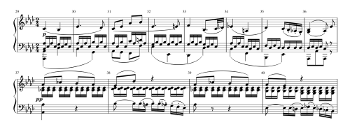
(click to enlarge)
Table 1. Fifteen emotion terms derived from a content analysis of 592 discrete comments (totaling 453 of the 592 comments), along with the number or responses that were classified as belonging to each category in parentheses
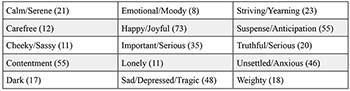
(click to enlarge)
Example 2. A screenshot of the interface used in the empirical study. Participants listened to each segment first and then adjusted the slider for each of the three emotion categories assigned
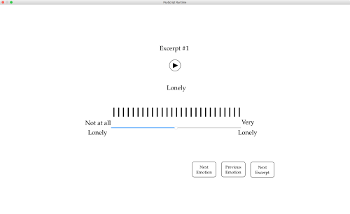
(click to enlarge)
Example 3. Expressive analysis of mm. 34–44 of Beethoven’s Pathétique Sonata, second movement
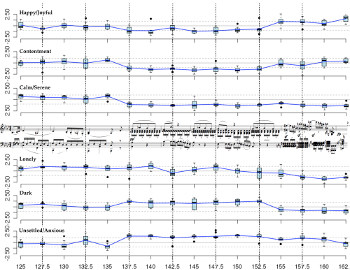
(click to enlarge)
Example 4. Average ratings for each of the five statements of the theme for sad/depressed/tragic, carefree, and weighty dimensions averaged over each segment comprising the statement
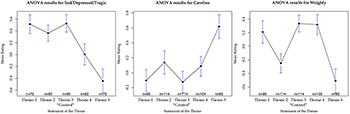
(click to enlarge)
Table 2. Group means (standard deviations) for expressive dimensions averaged over each of the five statements of the theme
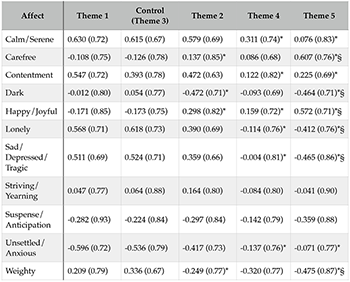
(click to enlarge)
Table 3. Extreme ratings by formal section
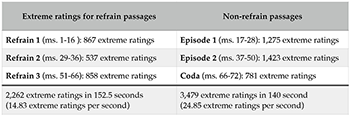
(click to enlarge)
Example 5. Expressive analysis of measures 20–29 of Beethoven’s Pathétique Sonata, II

(click to enlarge)
Table 4. The sixteen musical gesture parameters used as measured predictor variables in a regression analysis of the data from the movement
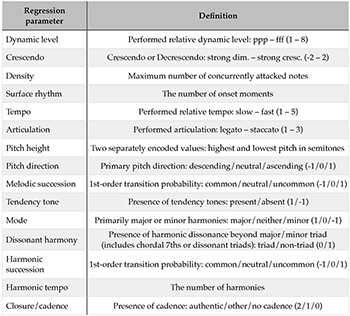
(click to enlarge)
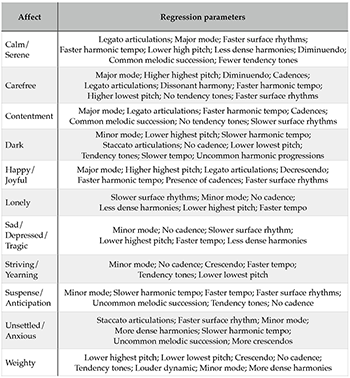
Table 5. Regression models based on the analysis and perceived emotional expression of each five-second segment
(click to enlarge)
Example A1. Histogram showing intra-participant correlations for each participant-scale. 76 participant-scales had correlations lower than +.25, and so were eliminated from further analysis

(click to enlarge)
Table A1. Means (standard deviations) of intra-participant reliability for each affective category averaged across participant-scale

(click to enlarge)
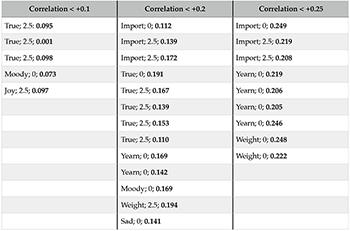
Table A2. The mean inter-participant correlations for all participant-scales below +.25 correlation
(click to enlarge)